|
|
|
|
Published July 2002
Velocitop Catapult is a commercial-grade enterprise software product that addresses Java-to-Oracle performance tuning via the JDBC layer.
Using a methodology called "Roundtrip Optimization", performance
data is automatically gathered from applications with near-zero overhead. This
data is fed to the Catapult tuning server, which identifies slow queries, automatically
experiments with optimizations, takes user input and approvals through a web-based
administration tool, and then returns optimizations and load-control commands
back to the application. Velocitop also provides a suite of operational tools
to ensure consistent levels of performance and uptime.
Catapult is implemented via two components:
library that gets linked into your J2EE application and can work with virtually
any Java application.
the Velocitop JDBC wrapper. It collects performance data, tests optimizations,
and provides a web-based administration tool.
Installation of the Velocitop Catapult software is quick and does not require
any code changes or recompilation. To install the Tuning Server, you simply
download the code from the Velocitop website, run the startup script, and complete the web-based installation wizard.
To install the JDBC Wrapper file for the Oracle JDBC Driver, you would swap
the appropriate driver file included in the download (depending on whether you
are using the Oracle Thin Driver or OCI Driver) with your current Oracle JDBC
driver .jar / .zip. Finally, you would update the JDBC connection info to reference the Tuning Server.
Once the JDBC Wrapper and Tuning Server are installed, you can log into the
web-based console to complete the configuration process and begin viewing profile data and optimizations.
Catapult consists of the following four functional modules:

Before roundtrip optimization can begin, the JDBC drivers must be properly
configured for speed. Oracle's user manual describing how to set up and configure
the Oracle JDBC drivers is so lengthy (700 pages!), that important performance
features, such as native connection pooling or prepared statement caching, are
often overlooked. Velocitop Catapult provides a detailed configuration wizard,
so you can get your system up and running quickly with the proper performance
configurations. Catapult also provides a tool to centrally manage and verify
connection settings, such as application logins, as well as restart database
connections without restarting applications. An additional benefit of the connection
management console is that all connection logins are always encrypted. This
closes a major security hole relating to storing database logins in clear-text files on application servers.
For the example used in this article, we have a Java application using the
Thin JDBC Driver. Using the Connection Manager, we disable Oracle Connection
Caching, enable Oracle Pooled Connections, and specify a maximum of ten simultaneous Tuning Server connections for optimization testing.

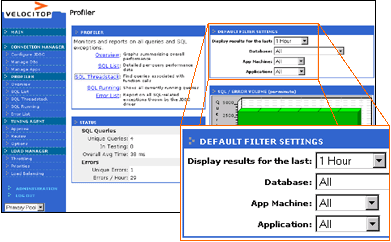
We then use the Profiler module which monitors and reports on all SQL queries
in order to gain visibility into SQL performance and exceptions over any specified
period of time. In this example, we are interested in seeing what has caused
a slowdown over the last hour. We use the Profiler's functionality to sort queries
by their performance impact based on various measurements such as total execution
time, time to "first row", and number of times called. We also then
filter the reports in a variety of ways - by database, by application machine, by thread, or by application - to further isolate the problematic SQL.
Catapult's unique JDBC-wrapper technology allows it to
gather a variety of detailed performance statistics, including Java stack-trace
information. We use this stack trace function to correlate SQL queries to the
Java functions that called them, and vice-versa. The Velocitop JDBC wrapper
is engineered to have a very low overhead (approximately 1% performance impact), making it suitable for both QA and production environments.
In our example, we find that the top-ranked SQL statement in terms of negative performance impact is
SELECT MIN(amount), ?
FROM Sales WHERE custID<?
This SQL statement has an Average Total Execution time
of 630 ms, and an Average First Row Execution Time of 550 ms which is ten times
greater than the second-ranked statement so it is an obvious culprit for the
system slowdown. We then open the Stacktrace Browser to see the breakdown of all Java functions that called this SQL (by distribution of calls):
(100%) java.lang.Thread.run(Thread.java)
(100%) SalesApp.run(SalesApp.java)
(100%) SalesApp.runTest(SalesApp.java)
(100%)
com.velocitop.wrappers.VT_OraclePreparedStatement.executeQuery(Unknown Source)

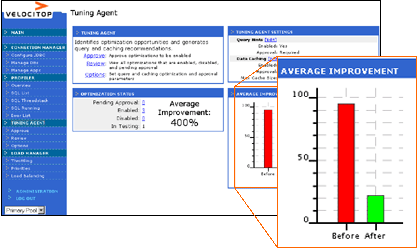
We now move on to the Tuning Agent, which collects the performance data from
the JDBC wrapper and then runs a variety of tests to identify optimization opportunities relevant to both SQL hints as well as data caching.
In our example, the Tuning Agent has tested nine query variations for the SQL
statement, and has found that the following revised statement represents the optimal alternative:
SELECT /*+ INDEX (Sales SALES_PRODUCT_INDEX) */ MIN(amount), ? FROM Sales WHERE custID<?
Catapult also generates a caching optimization related to this statement of
500 bytes, with a 20-second expiration timeframe. With these two optimizations
in place, we can already see a significant improvement in performance for our application.
Catapult will only run optimization tests when there is sufficient load, as
test results will not be accurate when run during off-peak hours. However, Catapult
is non-intrusive when running tests on a production system as it spreads tests
out over time and cuts off under-performing tests early, so as not to impact
the overall system performance. Additionally, Catapult continually compares
the tests to a control group, to make sure that any identified optimizations are statistically significant.
All optimizations can be approved before going live using the Catapult web-based
administration tool (or, Catapult can be defaulted to "auto-approve"
all optimizations). Once approved, optimizations are transmitted from the tuning
server back to the JDBC-wrapper. Most optimizations, load control commands,
and connection settings can be implemented transparently, without stopping and
starting application machines, another added benefit that improves overall system
uptime. Graphs then show performance before and after optimizations, for easy confirmation of performance improvements.
With manual performance tuning, optimizations are often left aside as the engineer
moves on to other more pressing tasks. Catapult, however, continually reviews
and re-tests optimizations, to make sure optimizations are still valid as your
system changes over time (e.g. Indexes added or dropped, larger or smaller data
sets, different mix of SQL queries, etc.). Also, since Catapult is an automated
software solution, it is able to consider all of your SQL queries, so it's a
valuable ally to engineers who are often too time-constrained to be able to
fine tune more than a small handful of queries.

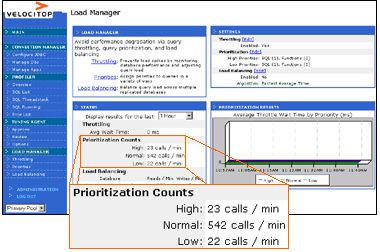
In addition to specific query-level optimizations, Velocitop provides new
techniques to help manage overall query load. Velocitop monitors database performance
in real-time, and then can queue up queries if the overall performance suddenly
degrades (also known as 'throttling'). This can prevent a "total database
meltdown" scenario, where the database is so overloaded it has no chance
of recovering and must be restarted. This can often happen with hardware failures (e.g. a disk drive fails) or an unplanned spike in user traffic.
Another load management function is query prioritization. This works with throttling
to allow you to prioritize specific queries ahead of others. Prioritizations
can be defined in a variety of ways, including by Java function, SQL call, customer
ID, etc. During a slowdown, higher priority queries are executed before lower
priority queries, to ensure that your most important queries get through. This
helps to assign your system resources based on your business requirements (i.e. the most important customers get the best experience).
Catapult also provides query load balancing functionality. If you have multiple,
replicated databases in an Active-Active configuration, Catapult can load balance
your queries across these multiple databases. In the event that one database
experiences a slowdown, queries can be automatically re-routed to the fastest
database.
Performance problems can quickly create major headaches
for operational managers and engineers, as they are expensive to resolve and
difficult to predict and, therefore, difficult to budget. Velocitop focuses
on the link between applications and databases, as this is a key area for performance
tuning and provides the best returns for the time and money spent. Velocitop
Catapult is a commercial-grade, fully automated solution for JDBC layer performance
tuning. It delivers database connection configuration and management, low-overhead performance profiling, automated tuning, and query load control.
Catapult delivers a compelling ROI by making employees more productive and
saving money on performance consulting services. Engineers are freed from having
to work on low-level tuning tasks and can quickly identify the source of problems
with detailed JDBC-level profiling information. Also, by improving overall system
performance and normalizing response time during spikes, Catapult enables managers to postpone expensive hardware and software upgrades.
Catapult
To get a 2-week evaluation copy of Velocitop Catapult, go
to the Trial page. Catapult requires
one machine to use as the Tuning Server running Solaris, Windows, or Linux, with
500Mb Disk and 200Mb RAM available. Catapult supports all J2EE/Oracle applications.