Java Performance Tuning
Java(TM) - see bottom of page
Our valued sponsors who help make this site possible
JProfiler: Get rid of your performance problems and memory leaks!
Training online: Concurrency, Threading, GC, Advanced Java and more ...
Tool Report: IronEye SQL
|
JProfiler
|
|
Get rid of your performance problems and memory leaks!
|
|
JProfiler
|
|
Get rid of your performance problems and memory leaks!
|
|
|
Published May 2003
The JavaPerformanceTuning.com Tool Reports are designed to help readers make
informed choices about the tools they may wish to use. JavaPerformanceTuning.com
provides these reports as a service to our readers; JavaPerformanceTuning.com is
not responsible for the information provided by the tool author or vendor, nor
do we necessarily endorse the products mentioned. JavaPerformanceTuning.com is
not responsible for any additional resources provided from the article (such as
downloadable files or other accessible material), even where we host such material.
TABLE OF CONTENTS
- Introduction
- How it
Works
- Installing
IronEye SQL
- How
to Use IronEye SQL
- Customizing
Filters
- Query
Optimization
- Suggested
Optimizations
- Conclusion
- Obtaining
a Free Trial Version
- About
IronGrid
Introduction
In typical application development, one of the most constrained resources
(and causes of "slowness") is database access.? In general, sending
requests over the wire (network I/O) and getting data from persistent storage
(reading and writing to the database) are the two places that can cause performance
deficiencies orders of magnitude greater than using a bubble sort instead
of a quick sort.
IronEye SQL is a new tool from
IronGrid that helps developers uncover some of the most bedeviling JDBC performance
problems?slow queries, degrading performance, and beans that thrash the database?by
providing an elegant way to intercept and time every interaction between an
application (or application server) and a database.?? Using a JDBC driver
wrapper, IronEye SQL provides Swing-based charts and graphs to analyze the
performance of each SQL query.? It works with any JDBC compatible database,
intercepts every database call, and requires no changes to source code.
How it Works
IronEye SQL provides a JDBC driver
wrapper that a developer substitutes for the application?s native driver.?
The wrapper intercepts all SQL being passed between an application (or application
server) and a database.? Using a Java Swing-based GUI (similar to JMeter),
developers can sort or filter SQL statements by various criteria.? Unlike
other JDBC profiling tools, IronEye SQL does not require the installation
and maintenance of its own separate application server.? Each developer in
the organization can independently install and use the IronEye SQL GUI on
his own machine without affecting the rest of the organization.
Also, because IronEye SQL relies
on a vendor-neutral SQL wrapper, it can be used on Oracle, Sybase, Microsoft
SQL Server, MySQL, Foxpro?and any other database for which a JDBC wrapper
is available.
Installing IronEye SQL
Installation simply involves swapping
the current JDBC driver for the driver wrapper, and then configuring the wrapper
to use your original driver.? Start-to-finish, installation should take about
15 minutes.
The first step is to download
the 30-day free trial software from http://www.irongrid.com/ironeyesql.?
The basic steps to set up the program are:
- Run the installer program,
ironeyesql-install-1.0.nnn.exe.? The installer
will prompt you for an installation directory.
 When installation completes, the
IronEye SQL application automatically starts and prompts you to configure
your JDBC driver.
When installation completes, the
IronEye SQL application automatically starts and prompts you to configure
your JDBC driver.
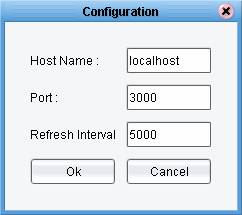
In the Configuration dialog, enter the hostname of the machine on which
the JDBC driver wrapper will be running.? If the application is running
on your local machine, enter ?localhost?.
Next, select the Port the driver will use to communicate with the GUI.?
Port 3000 is configured by default, so you may need to change the setting
if another application is already using that port.
Finally, leave the Refresh Interval setting at 5000, unless you would like
the GUI to poll the wrapper driver more frequently (set it lower to poll
more frequently).
- Go to the IronEye SQL installation
directory that you specified in Step 1.? The top-level directory (e.g. C:\Program Files\IronGrid\IronEyeSql),
contains three files:
ironeyesql.jar
p6spy.jar
spy.properties
Copy these files into your application (or application server?s)
classpath.?
Since each app server is different, customized instructions are available
at: http://www.irongrid.com/documentation/
for numerous application servers (e.g. Weblogic, JBoss, Tomcat, Websphere,
Resin, and others).
- Edit your application?s current
JDBC configuration and point the driver to:
com.p6spy.engine.spy.P6SpyDriver
- Open to the directory to which
you copied the spy.properties
file.? Edit the spy.properties
file and point it to your original JDBC driver (this example assumes it
is Oracle):
realdriver =
oracle.jdbc.driver.OracleDriver
Also in the spy.properties
file, configure the port number that will be used to share the profiling
data with the GUI (this should be the same port number you selected in Step
2, port 3000).
monitorport=3000
- You configuration is now complete.?
You can start your application server or database application and IronEye
SQL will automatically intercept and analyze your SQL data.
- Return to the IronEye SQL application
and click the Connect button.? If IronEye SQL is not currently running,
click Start -> Programs
-> IronEyeSql -> IronEyeSql.
You can Connect and Disconnect
to your application?s profiling data by clicking ?Connect? and ?Disconnect.??
Whenever your application sends a SQL query to the database, IronEye SQL will
register a line in the console for each query.
 How
to Use IronEye SQL
How
to Use IronEye SQL
As your application runs, each
database query sent to the JDBC layer will appear in IronEye SQL?s interface.?
The application allows you to sort queries based on:
a) the number of times the query was called,
b) the query?s average total time,
c) the query?s maximum time
Clicking on an individual query displays more detailed performance data in
the bottom of the console via three graphs, which include: Rows Returned,
Time Performance, and Count.?
 Rows Returned displays the
maximum, average, and minimum rows returned that match the selected SQL
statement.? The same query can return different numbers of rows depending
on the state of the data at the moment the query executed or the parameters
passed in a PreparedStatement.
Rows Returned displays the
maximum, average, and minimum rows returned that match the selected SQL
statement.? The same query can return different numbers of rows depending
on the state of the data at the moment the query executed or the parameters
passed in a PreparedStatement.
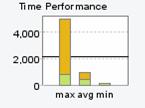
- Time Performance displays
the maximum, average, and minimum completion times for the selected SQL
statement.?
- Count displays the number
of times the selected SQL statement has run since the server was started
(or last purged).?
In addition to reporting the overall
time for each query, IronEye SQL also reports Preparation time, Execution
time, and Retrieval time for each query.

- Preparation time is
the amount of time between when a statement is created and when it is executed.?
In other words, it is the time between when you call?
Statement stmt
= conn.createStatement();
String strSql = ?SELECT * from properties WHERE property_units > 4?;
?and when you call?
ResultSet res =
stmt.executeQuery(strSql);
- Execution time is the
amount of time that the executeQuery()
or executeUpdate()
methods require to finish.
- Retrieval time is the
total time spent in the ResultSet.next()
method.? Since the .next()
method is often called for each row retrieved, as the number of rows (or
amount of data) increases, retrieval time also increases.
IronEye SQL also features an Export utility that enables users to export
performance data in a HTML formatted document.? This allows users to share
performance testing results with others, such as other developers or third-party
software vendors whose code may be responsible for performance degradation.
Customizing Filters
Because IronEye SQL captures every
query sent by an application, the interface provides filtering capabilities.?
Filtering will help you focus on key tables or the most problematic queries,
suppressing those that are within expected performance boundaries.
For example, to filter the queries
so that only those queries that average more than one (1) second, enter ?1000?
in the left-most Average Time field, and click Apply Filter (not pictured).
Or, to filter queries so that
only those queries that have never executed in anything less than one (1)
second are displayed, enter ?1000? in the left-most Min Time field, and click
Apply Filter (pictured below).

To filter only certain queries,
enter the entire query in the SQL field, and click Apply Filter (not pictured).
Query Optimization
The data IronEye SQL produces
helps developers discover and test optimizations.? Instead of putting blind
trust in a black box optimization engine or a monolithic suite of third-party
software, IronEye SQL gives developers control over the optimizations that
are appropriate for their application.? This approach focuses on addressing
the root cause of performance problems and the least expensive, most reliable
solution?better code.
Suggested Optimizations
Armed with information from IronEye
SQL, developers can return to their code to focus on improving the queries
that harm database performance the most.? Following is a list of improvements
based on the types of problems that IronEye SQL commonly uncovers:
- High preparation time.?
Queries that require high preparation time may perform unnecessary activities
in the time between when a statement is initialized and when it is executed.?
Consider moving any code related to building the SQL query before creating
the Statement object.
- Frequent queries.? Queries
that are called frequently should be considered as candidates for data caching.?
Simple caching strategies involve copying the RecordSet values into a Collection
or using the CacheRowSet API described in this article at JavaWorld: http://www.javaworld.com/javaworld/jw-02-2001/jw-0202-cachedrow_p.html.
Repeat queries of the same basic form should be considered for conversion
to a PreparedStatement.?
Java?s PreparedStatement
object gives the database an opportunity to pre-parse the query, which can
be especially time-saving when a query is repeatedly called.
Consider consolidating multiple queries of the same table into a single
statement.? For example, one developer found that his application was querying
the database to retrieve a list of all ID?s from a table, then looping through
the list to instantiate a bean for each ID.? The problem was that each bean
instantiation, in turn, required a separate query to the database.? By changing
the bean?s constructor to allow for an alternative instantiation, he was
able to consolidate thousands of queries into a single query, reducing the
execution time from over 75 seconds to under 20 seconds.
- High execution time.?
Time spent in the executeQuery()
or executeUpdate()
methods is time that the database is spending to process and execute the
query.? As a result, performance optimization can be approached from two
directions?from the application side and the database side.
In the application, developers can attempt to simplify queries to make them
easier for the database to interpret.? If the query is repeatedly called,
converting the query to a PreparedStatement would lower the cost of repeat
query parsing.? Queries should also be examined to consider if they can
be rewritten to avoid complex joins, or if the table design should be re-analyzed
to improve performance.? Another execution bottleneck may be database-layer
scripts such as triggers and stored procedures.? Strictly speaking, executing
a script in the database layer is suboptimal for two reasons: 1) it requires
CPU cycles on the most constricted resource, and 2) script execution is
not the strength of the database.? Run the programmatic code on the application
layer rather than the database, because compiled code will generally be
faster and does not take cycles away from the bottleneck resource.? Alternatively,
consider rewriting the SQL or database script to improve its execution time,
for example, by using a compound or nested statement instead of an iterative
statement.
In the database, work with the DBA to investigate improvements to the database
configuration such as adding indexes, increasing the SQL parsing cache,
optimizing disk I/O by separating database tables from logs, and implementing
database-specific hinting mechanisms (e.g. Oracle?s /* */ syntax) and idioms
that improve the database?s query execution plan.
- High retrieval time.?
Retrieval time includes all of the time spent returning records from the
database to the application.? The primary drivers of this time are the number
of rows returned, and the amount of data in each row.? Queries should be
examined for opportunities to limit the number of columns or rows (or both)
returned.? If the database stores large BLOB?s in a table (such as employee
photos), returning the entire table via a ?SELECT *? statement may transfer
an unnecessarily large amount of data across the network.? Consider returning
fewer records, fewer columns, or both.??? Also, developers should consider
whether all of the rows are needed at once, or if paging can be used to
download only the data needed for the current step in execution.
Conclusion
Database performance problems
can be the hidden killer in overall application performance.? With complex
applications, encapsulation, and automated O/R mapping frameworks, database
performance problems can go unnoticed until the worst possible time?just as
an application?s usage begins to rise.? IronEye SQL equips developers with the
tools to analyze query performance early, and fix performance problems at
their root.
By operating as a JDBC wrapper,
IronEye SQL requires no code changes.? Analytical data is presented via a
Java Swing interface, avoiding the need to install, set up, and maintain a
separate application server specific to performance tuning.? Morever, IronEye
SQL does not require changes to production systems or architecture.?
IronEye SQL is an inexpensive
tool (priced at $195 through 5/31/2003 and $395 thereafter) that you can install
and configure in under 15-minutes, requires no code changes, and provides
instant insight into one of the most insidious sources of performance problems.
Obtaining a free trial version
To obtain a free 30-day trial version of IronEye SQL, download a copy from
?http://www.irongrid.com/ironeyesql.?
Download IronEye SQL before May 31, 2003 and you will automatically be entered
in a contest for $2,500 in cash (please see http://www.irongrid.com/catalog/promotion_home.php
for complete contest details).
About IronGrid
IronGrid, Inc. provides lightweight
Java development tools that solve specific problems and provide immediate
results to Java application developers.? Products are affordably priced for
wide usage, can be installed quickly, and require no changes to a developer?s
source code.? IronGrid focuses on products that enable software performance
turning throughout the development cycle, to help developers deliver software
that is on time, on budget, and on spec.? The tools support a practice called
continuous performance. ?Like continuous integration, continuous performance
is an extreme programming extension that favors performance testing throughout
the entire lifecycle of an application. IronGrid is venture-backed and headquartered
in Austin, Texas.
Last Updated: 2026-04-29
Copyright © 2000-2026 Fasterj.com. All Rights Reserved.
All trademarks and registered trademarks appearing on JavaPerformanceTuning.com are the property of their respective owners.
Java is a trademark or registered trademark of Oracle Corporation in the United States and other countries. JavaPerformanceTuning.com is not connected to Oracle Corporation and is not sponsored by Oracle Corporation.
URL: http://www.JavaPerformanceTuning.com/tools/ironeyesql/index.shtml
RSS Feed: http://www.JavaPerformanceTuning.com/newsletters.rss
Trouble with this page? Please contact us
