|
|
|
|
Published June 2002
JProfiler is a Java profiler combining CPU, Memory and Thread profiling in one application. It is developed by ej-technologies and currently in version 1.2.
JProfiler offers two different kinds of sessions:
For the example used in this article, we will profile a GUI application using a local session. We have selected the Jclasslib class file browser as our application (available from http://jclasslib.sourceforge.net), a tool for displaying Java class files and bytecode. While Jclasslib provides a lot of insight into the Java class file format, the bytecode display seems to be quite memory intensive and fairly sluggish for displaying large methods. We'll use JProfiler to identify the bottleneck.
If we were starting Jclasslib from the command line, we would use
java -cp "C:\Program Files\jclasslib\jclasslib.jar" "-Dclasslib.laf.default=true" org.gjt.jclasslib.browser.BrowserMDIFrameTo start Jclasslib using JProfiler, we fill in the same details into the JProfiler session details window.

 First, we create a new session to start the application, then we fill in the
same details we would use on the command line: main class; class path; VM parameters.
The VM parameters field here is used to change the look and feel of the class file browser.
JProfiler lets you specify which packages you want included in the profile report.
This useful feature allows you focus on the bottlenecks separately from the various
components of an application. The Jclasslib package starts with org., so we
disable the corresponding filter on the "active filters" tab of the configuration dialog
(see second screenshot on the right). This ensures that org.* classes will be
reported in our profile.
Now we have configured our session with all the necessary information, we save the session and start it. A terminal window appears, capturing the stdout and stderr output of the profiled application (Jclasslib in this example) and the Jclasslib class file browser appears. During the startup phase JProfiler immediately starts displaying live information in all its views. If you'd rather have static snapshots on demand, there are buttons for freezing all views and fetching data manually in the toolbar.
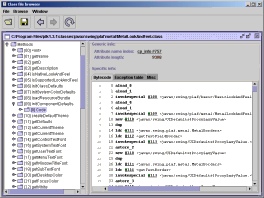 To identify the bottlenecks in Jclasslib, we now select a very large method to display
in the Jclasslib browser window: for our example we will browse the
javax.swing.MetalLookAndFeel.initComponentDefaults method, which
is 9 kB of bytecode. Before we select the method for display, we reset the CPU
data in JProfiler to eliminate the profiling information collected during startup of
Jclasslib. We are interested in profiling the Jclasslib display action, not the
Jclasslib startup. Displaying the javax.swing.MetalLookAndFeel.initComponentDefaults
method in the Jclasslib browser takes quite a long a time, and the heap size expands
to a whopping 40 MB. This is the inefficient action we want to look at for our example.
We freeze all the views in JProfiler and start working on the analysis.
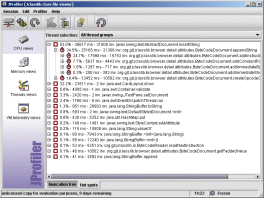 First, we look at the performance problem. The key to finding out where
all the time is spent is JProfiler's "Hot spots view". The top level entries
are the most time consuming methods. We can see immediately that most of the
time is spent in
 javax.swing.AbstractDocument.insertString (53%) and
java.awt.CardLayout.show (32%). By expanding the top level nodes we
get the backtraces showing the various ways the hot spot method was called.
Here's where the "filter sets" we earlier defined come into play.
Of course, javax.swing.AbstractDocument.insertString calls a
zillion other methods, but since javax. was selected as a filtered
package, all these subsequent calls are summed up in the first method that was
called from an unfiltered class, typically code written by yourself.
What happens inside javax.swing.AbstractDocument.insertString
is the internal mechanics of an external package which is outside your influence.
If you were interested, you could always turn off the corresponding filter set.
From the CPU profile, we can see that all invocations to
javax.swing.AbstractDocument.insertString originate in
org.gjt.jclasslib.browser.detail.attributes.BytecodeDocument.
This is the document that's used to display the method bytecode in the class file
browser. The java.awt.CardLayout.show was then called when the document
was actually displayed.
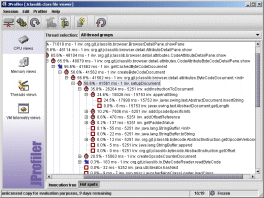 The "Hot spots view" is a bottom-up view. JProfiler also offers a top-down view
displaying the entire call tree. While the "Hot spots view" cumulates times for all
invocation paths, the "Invocation tree" is perfect for finding single bottlenecks
by expanding the tree along the large percentage values. It also gives you a
feeling for the execution speed of various application components as well as a bird's
eye view of the call flow. This view is useful for debugging as well as profiling.
Both through the "Hot spots view" and the "Invocation tree" we arrive at the same
conclusion: javax.swing.AbstractDocument.insertString is extremely
slow (here over 1 ms per call) and preparing the document for rendering
is equally costly. Next, we turn to memory profiling to see whether the large
heap size is connected to this performance bottleneck.
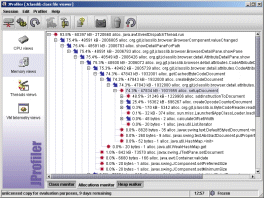
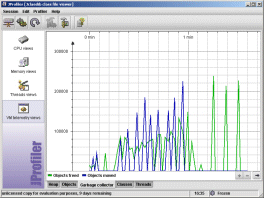 When we look at the garbage collector telemetry view, we can see that during the
creation of the document a substantial number of short-lived objects are created on the
heap. In the allocations monitor (second screen shot on the right), we can
show the garbage collected objects by clicking on the trash can in the tool bar.
By expanding the call tree along the large instance count values, we arrive at
the same trouble spot as detected on the previous page. Below
BytecodeDocument.setupDocument
nearly 2 million objects have been allocated and garbage collected. This certainly
constitutes a huge waste of resources completely out of proportion with respect to
the performed task.
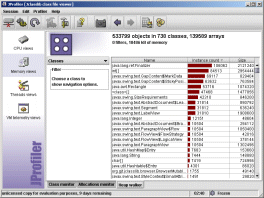 Now we'll use JProfiler's heap walker to examine this allocation problem from a
close-up perspective. After taking a heap snapshot, we go to the classes view
and find that more than half a million objects and 140000 arrays are still alive on the
heap - mostly for displaying the 3000 lines in the bytecode document!
JProfiler's heap walker is quite different from the heap analysis views of competing products in that it operates on arbitrary object sets - and not on objects of a single class only. For every object set you can choose between six different views: classes, allocations, outgoing references, incoming references, class data and instance data. By selecting items in these views and using the navigation panel on the left, you can add new filter steps and modify your current object set. With the forward and back buttons in the tool bar you can move around in your selection history.
The classes view of the heap walker reveals three issues:
java.lang.ref.Finalizer objects
on the heap, a package-private class that has to do with weak references
int arrays and object arrays
(the virtual machine has no type support for arrays of class instances, that's
why it's denoted as <class>[]). The int arrays
account for the largest chunk of memory.
javax.swing.text
package - this was to be expected after the previous findings.
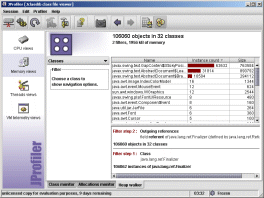
 Let's find out what these strange finalizer objects do. We add a filter step by
selecting
 java.lang.ref.Finalizer, and choose the "Outgoing references"
in the navigation panel. The result is shown in the first screenshot on the right.
Since java.lang.ref.Finalizer is derived from
java.lang.ref.Reference it has a referent field which
holds the content of the weak reference. Consequently, we select this
referent field and choose the "Classes" option in the navigation panel.
As the second screenshot on the right shows, the overwhelming majority of weak
references can be attributed to the javax.swing.text package.
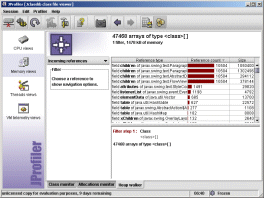
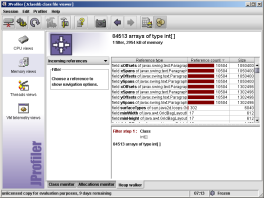 Finally for object and
 int arrays we go back to the classes view and
add filter steps by selecting the item in question and choosing "Incoming references"
from the navigation panel. As a result, the two screenshots on the right show
who is referencing these arrays. Again, the javax.swing.text is
responsible for allocating these resources.
From this study it becomes clear that the javax.swing.text package
doesn't quite cut it for large documents with lots of formatting.
If we remove the formatting and append the bytecode document as a single string,
all problems are gone: zippy performance and resonable memory consumption.
So, in order to keep the formatting, one would have to develop a new component
to render the bytecode document by looking at the data model and generating the
displayed text on the fly.
Besides the views presented above, there are many other views and features in JProfiler. Also, JProfiler 2.0 (the successor to the version shown here) is expected for summer 2002 and will greatly expand on thread profiling, allow for offline profiling, present quite a few new views and offer application server integration wizards to make profiling servlets and EJBs much easier.
To get a 10-day evaluation copy of JProfiler, go to the trial download page, enter your name and e-mail address and download the version for your platform (Windows, Linux X86, Mac OS X or Solaris SPARC). With the Windows version, you get a setup executable that installs JProfiler and launches it right away. When running JProfiler for the first time, a setup wizard comes up and collects the license information that has been mailed to you as well as some information about your runtime environment. When the "open session" dialog appears, you're ready to go.