|
|
|
|
Published January 2007 (Initially Published November 2005)
The NetBeansTM Profiler is an optional feature of the NetBeans Integrated Development Environment (IDE). The NetBeans Profiler is a powerful tool that provides important information about the runtime behavior of an application. Imposing relatively little overhead, the NetBeans Profiler tracks thread state, CPU performance, and memory usage. It uses innovative technology to allow you to tightly control exactly which parts of an application are profiled, resulting in reduced overhead and easier to interpret results. The profiled application can run locally or on a remote system. And by being tightly integrated into the IDE workflow the NetBeans Profiler makes it easy to identify performance problems and memory leaks.
The NetBeans Profiler can profile applications running on the following JVMs:
Once installed, the module adds the Profile menu item to the menu bar.
The Profile menu allows you to start
profiling and work with the results. The module also adds two toolbar buttons
that are shortcuts to the Profile command (  )
and the Attach and Profile command (
)
and the Attach and Profile command (  ).
).
The NetBeans IDE is the base product on which Sun Java Studio Enterprise (JSE) is built. JSE also offers profiling features.
The NetBeans Profiler provides a number of internal settings that let you tune profiling to your needs. For example, you may decrease the profiling overhead at the cost of some reduction in the amount of generated information. However, it may take some time to understand the meaning and use of the numerous settings available in the NetBeans Profiler.
For most applications, certain default settings are sufficient. For this reason, the NetBeans Profiler offers two major profiling options. You can start profiling by choosing a simple predefined profiling task, which has most of the settings preset to optimal values and therefore requires little or no tuning. Alternatively, you can create your own custom profiling configuration, where you are free to modify any of the available settings.
To start profiling an application:
When you click Run, the target application launches and the selected profiling command starts. The NetBeans Profiler control panel opens in the IDE.
To see the results of the profiling command, click the Live Results button
(  ) in the Profiler control panel
to open the Profiling Results tab.
) in the Profiler control panel
to open the Profiling Results tab.
To stop the profiling command, choose Profile > Stop from the Profile menu or click the
Stop button ( ![]() ). If you start the application with the
NetBeans Profiler, when
you stop the profiling command the application also stops.
). If you start the application with the
NetBeans Profiler, when
you stop the profiling command the application also stops.
The Select Profiling Task dialog box is the main interface for selecting and running profiles. The dialog box gives you five different ways of profiling the target application. The first four are predefined profiling commands. The last command, Run Custom Profiling, allows you to create your own custom profiling configuration.

When you click on a profiling command the box expands, displaying a brief explanation of the command and, for some tasks, allowing you to set some profiling options. Clicking Run at the bottom of the dialog box launches the target application and starts the selected profiling command.
Only one task, i.e. one kind of profiling, can be active for the profiled application at any given time (monitoring is always active however, even when another task is chosen, since its overhead is very low). Note that while profiling you can switch between profiling tasks without stopping and restarting your application.
You can choose from the following profiling tasks:
This profile command displays high-level information about several important properties of the target JVM, including thread activity and memory usage.
Application Performance profiles method-level CPU performance (execution time). You can choose to profile the entire application or a part of the application. Detailed filters can be set to control exactly which methods get profiled, allowing the rest of your application to run at full speed.
In this mode, the NetBeans Profiler instruments all of the methods of the profiled application. Threads emit the "method entry" event when entering a method and generate the corresponding "method exit" event when exiting the method. Both of these events contain timestamps. This data is processed in real time.
In this mode, you can instrument and profile a limited subset of the application's code. When partial application profiling is used, profiling data is not collected until one of the application's threads enters a user-selected root method. Profiling a limited subset of the application's code may greatly reduce the profiling overhead. Furthermore, for some programs this option may be the only way to obtain any detailed and/or realistic performance data at all as the amount of generated data when the entire application is profiled can be so high as to render the application unusable or even cause it to crash (for example, due to unexpected timeouts).
Use this mode when you want to analyze application startup time.
This command measures the time it takes to execute an arbitrary piece of code within one method, or the whole method. By analyzing a code fragment rather than the entire application, the profiling overhead is greatly reduced. The absolute results that you obtain in this mode are closest to the real runtime performance, since the instrumentation is the most lightweight.
When you analyze memory usage, the profiling results displayed depend on which of the following options you choose:
This option provides information about how many objects of each type are still alive, as well as data on live objects.
This option gives you information about the number, type, and location of objects that have been allocated. This profiling mode is a functional subset of object liveness profiling. The reason for having both modes is that pure object allocation profiling has a smaller performance and memory overhead.
By default only ten percent of all objects for each class are tracked by the NetBeans Profiler. This statistical approach has been shown to deliver results that are as accurate as when all objects are tracked, but with the benefit of greatly reduced profiling overhead.
This command is for running custom profiling configurations. You can create, edit, and save these custom configurations, allowing you to control all the internal profile settings.
The profiling control panel is displayed in the left pane of the IDE when you run the NetBeans Profiler. You can open the control panel by choosing Window > Profiling > Profiler Control Panel. It contains controls that do the following:
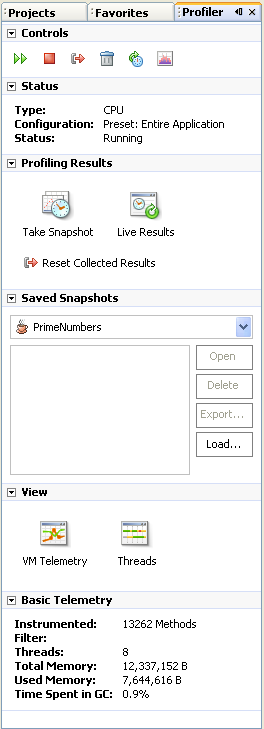
The NetBeans Profiler provides several displays of information.
The VM Telemetry Overview is always displayed when the Monitor Application command is chosen. To display it at any other time, select Profile > View > Telemetry Overview.
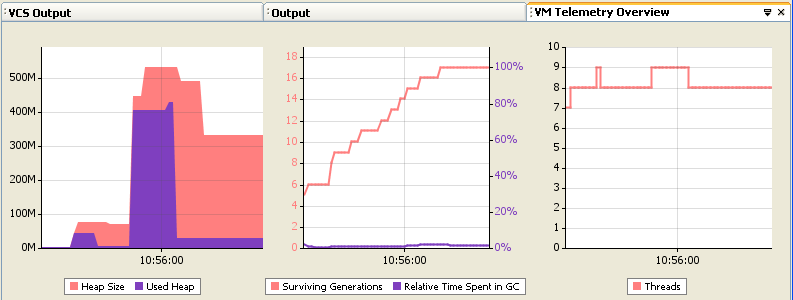
In the graph on the left the red shading indicates the allocated size of the JVM heap. The purple overlay indicates the amount of heap space actually in use. In the example above the allocated heap size at the last update was over 300 megabytes. Of that about 20 megabytes is actually being used to hold Java objects.
The graph on the right shows the count of active threads in the JVM.
The graph in the center shows two important heap statistics.
Thread state is optionally displayed when the Monitor Application command is chosen. It contains the following tabs:
Shows current and historical thread state, updated as the application runs.
Shows a summary of thread state information for a single thread.
A sample timeline graph is shown below.
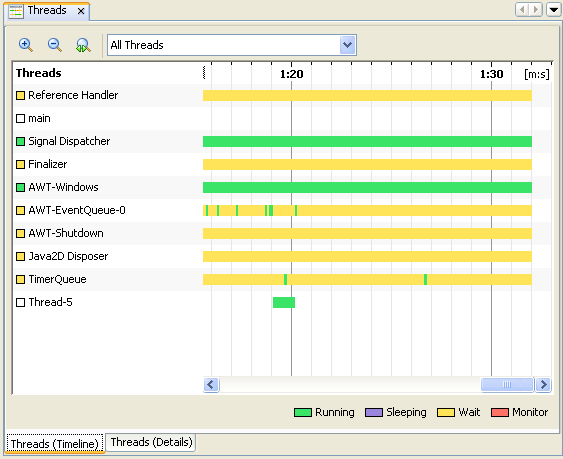
Color coding is used to display thread state:
Clicking the Live Results button
( ) in the control panel
will open the Profiling Results tab. Depending on the profiling command
that is running, this tab will display either
performance or object allocation and liveness statistics.
The NetBeans Profiler will update the displayed profiling results automatically
at short intervals (about 2 seconds) if the Update Results Automatically
button ( ![]() )
in the toolbar is clicked.
)
in the toolbar is clicked.
The CPU Snapshot captures data on method call chains, times, and invocations
when profiling CPU performance, either from
the Analyze Performance predefined task or when running a custom CPU profile.
The CPU Snapshot is displayed when you click the Take Snapshot
button (  ) in the control panel.
The CPU snapshot contains the following tabs:
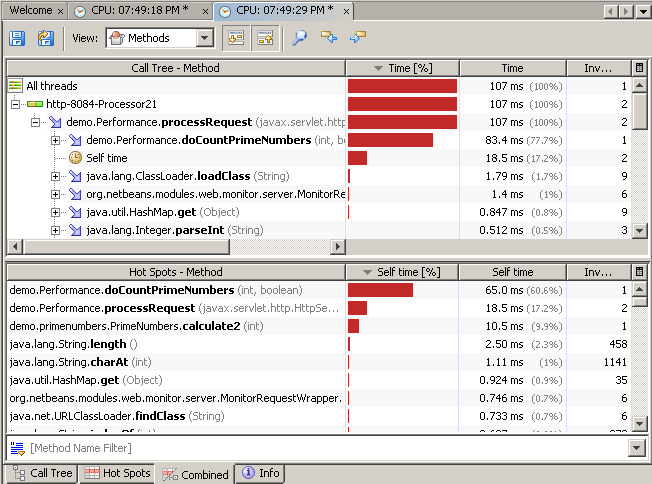
The Call Tree tab displays the Calling Context Tree (CCT) showing the method call chain and the time/number of invocations for executing threads and methods in each context. (A context is a unique chain of method calls leading to the method's invocation.)
The Hot Spots tab shows the total execution time and number of invocations for each method, irrespective of the context.
The Combined tab displays the CCT information in the upper half of the window and the Hot Spot data in the lower half.
The Info tab displays data on when the snapshot was taken, where it is saved, and the profile settings used.

The Memory Snapshot captures data on object allocation and liveness
when profiling memory usage with
the Analyze Memory Usage command or
when doing memory profiling in a custom profile.
The Memory Snapshot is displayed when you click you click the Take Snapshot
button ( ) in the control panel.
The Memory snapshot contains the following tabs:
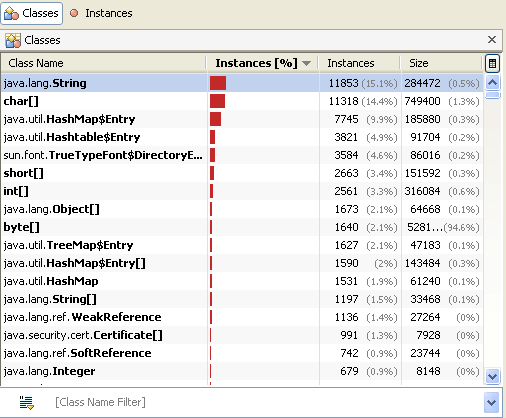
This tab displays a list of classes (including array classes), with statistics on the total size and number of instances allocated as of the time you took the snapshot. The specific information provided includes:
In this tab, you can right-click any class and select Show Allocation Stack Traces. The stack traces for the selected class are displayed in the Allocation Stack Traces tab.
This tab displays a reverse call graph with all call paths leading to object allocations for the given class.
The Info tab displays data on when the snapshot was taken, where it is saved, and the profile settings used.

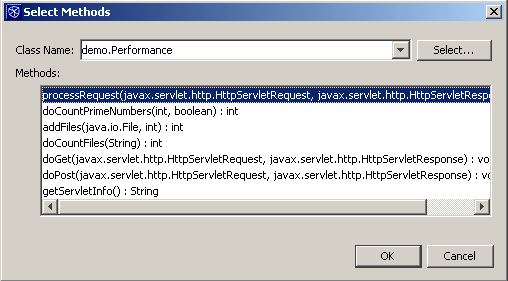
This example demonstrates just one feature of the NetBeans Profiler: the ability to quickly identify CPU performance problems. The example is a web application that just calculates prime numbers. When attempting to find performance bottlenecks, you typically know which features are running slowly. That allows you to narrow down the search for the bottleneck to a top level method for that feature. The NetBeans Profiler supports this by allowing you specify a root method for profiling.


The top window shows the complete method call graph beginning with the root method. The bottom window is a flatter depiction; it shows the Hot Spots in the application - those methods that took the most time to execute.
The 5.5 release of the NetBeans Profiler did not add much to the set of profiling features described in this tool report. It did add support for easily starting profiling sessions on enterprise applications and Enterprise Java Bean (EJB) code. It also added support for several environments that were not supported before. These include support for: 64-bit JVMs, application servers such as GlassFish and JBoss, and support for the Apple Mac OS X operating system. For full details, refer to What's New In NetBeans Profiler 5.5.
Looking ahead to NetBeans Profiler 6.0, the Profiler development team is planning to add several new features that help make the NetBeans Profiler even easier to use and more comprehensive. These features include:


All of the features listed above are still under development. Milestone builds of version 6.0 of the NetBeans IDE and the NetBeans Profiler are being made available on a regular basis - more information on milestones is available here. So please try out these new features - the NetBeans Profiler development team is interested in hearing your feedback: feedback@profiler.netbeans.org.
The NetBeans Profiler is a powerful tool that provides important information about the runtime behavior of an application. It can be used to identify thread state problems, CPU performance bottlenecks, and memory usage bugs. For more information, please visit the NetBeans Profiler homepage.
