|
|
|
|
Published July 2002
GCViewer is a little tool that visualizes verbose garbage collection data generated by Sun and IBM Java Virtual Machines (JVM). The analysis of this data can be useful for tuning applications in order to maximize the performance of the garbage collector and thus the application itself.
Supported verbose:gc formats are:
-Xloggc:<file> (preferred)-verbose:gc-verbose:gc-verbose:gc
To install GCViewer simply download the latest version from http://www.tagtraum.com/. Put the archive into the directory where you want to install GCViewer and unpack it. Then change into the newly created directory gcviewer-XXX.
On Windows systems, where JAR files are associated with the java launcher, you can simply double click on the file gcviewer.jar to start the application. In all other cases, you can start GCViewer like this:
java -jar gcviewer.jar
Once you have started GCViewer you will see a Swing window. The figure below depicts most of the available controls with a short description.
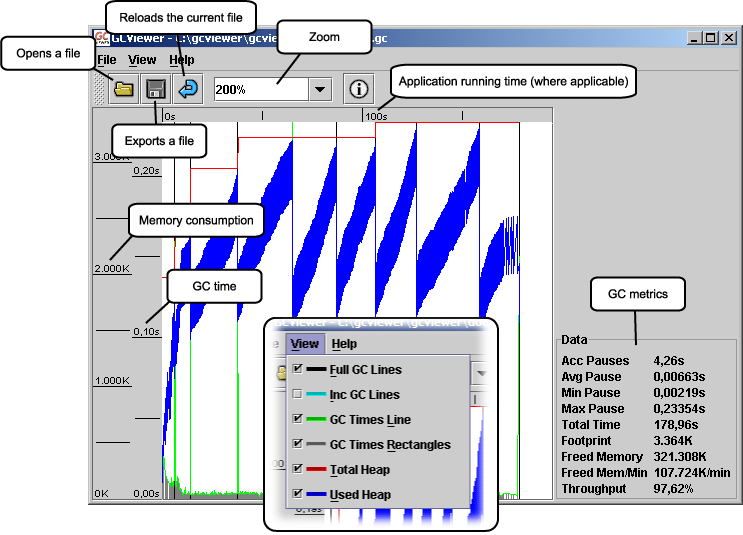
By using the View-menu you may turn particular lines on or off. ("Acc Pauses" is the accumulated pause time from garbage collections.)
Mostly it's server applications that benefit from tuning garbage collection. Therefore we want to look at a very simple (somewhat artificial) example of a serverside application. In our setup the webserver jo! is pounded by Apache JMeter for a limited time. To keep this example as simple as possible, the same resource is requested again and again.
In order to obtain garbage collection data, jo! is started with Sun JDK 1.4.0 Server and the following parameters:
c:\j2sdk1.4.0\bin\java -server -Xloggc:normal.gc ...
(off course this works under Unix/Linux, too)
The parameter -Xloggc:normal.gc tells the VM that it should write verbose garbage collection information to the file normal.gc. After our test run finished we open the file with GCViewer:
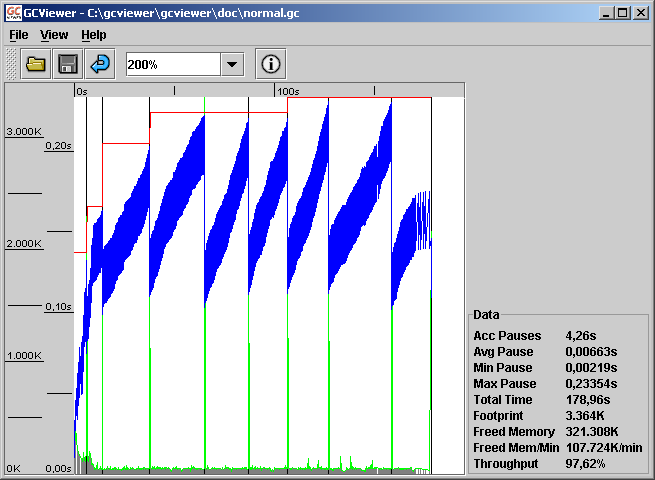
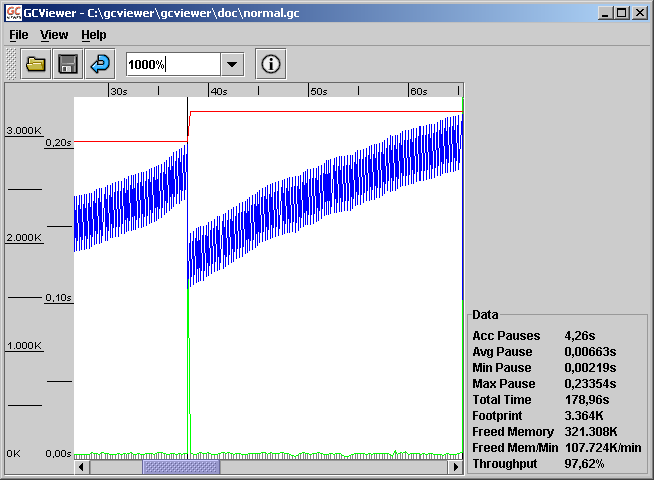
Probably the two most important lines in the graph are the red and the blue line. The red line indicates the total heap size, the blue line shows how much of the heap is actually used. As we can see the blue line follows a saw like pattern. If we increase the zoom to 1.000% it becomes obvious that this pattern is repeated in each tooth of the saw.
To understand why we see this doubled saw pattern, we have to take a look at the garbage collector being used.
Sun JDK 1.4.0 Server uses a generational garbage collector with two young generations and an old generation. New objects are always allocated in the young generation part of the heap. Every time the young generation is full a minor garbage collection takes place. In the graph this is indicated by the little grey lines at the bottom. As you can see from the length of these lines (and the green line), minor garbage collections don't take very long. Objects which survived some minor collections are promoted to the older generation. Usually the older generation is full at some point too, and needs to be cleaned. This leads to a major garbage collection that removes garbage from both the old and the younger generations. Full garbage collections are indicated by black vertical lines. As you can see in the graph (green line), full garbage collections take a lot longer than minor garbage collections. This is due to the fact that a larger part of the memory is cleaned and that the older generation uses a slower, but less memory consuming, garbage collection algorithm than the younger generation.
To summarize this: The saw pattern in the first figure (zoom 200%) shows full garbage collections, the saw pattern in the second figure (zoom 1 000%) shows minor garbage collections.
How can this help us tune the application? Well, after each minor collection the heap memory consumption is slightly higher than after the minor collection before. Some objects have been promoted to the older generation. But every time a full collection occurs the memory consumption (blue line) is reduced to more or less the same value as after the last full collection. This means that even though some objects were promoted to the older generation, most of them didn't become very old either. Which means, that maybe they should not have been promoted to the older generation in the first place.
In this particular scenario it seems beneficial to increase the size of the younger generation to prevent the early promotion of medium-lived objects. For Sun JDK 1.4.0/1.3.1 this can be achieved with the unsupported parameter -XX:NewRatio=<value>. This parameter defines the ratio between the young and the old generations. A NewRatio of 2 means, that the young generations use one third of the heap. The default value of this parameter differs depending on your VM, whether you use the Server HotSpot compiler or the Client HotSpot compiler and which platform you are operating on.
To see what effect a different NewRatio has on our application we start it like this:
c:\j2sdk1.4.0\bin\java -server -XX:NewRatio=2 -Xloggc:newratio2.gc ...
The figure below shows the result:
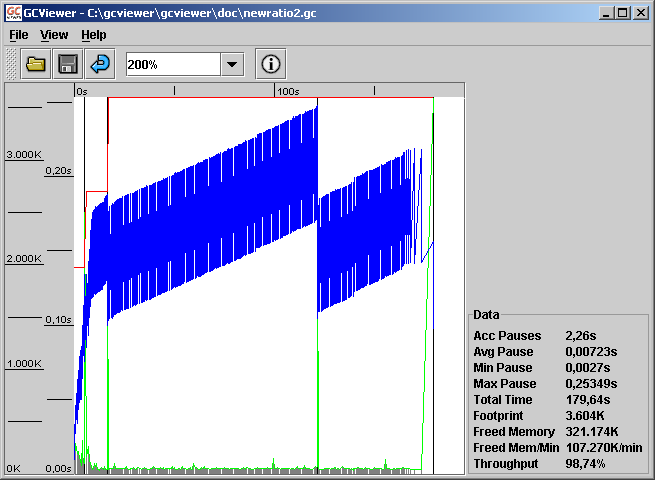
It is obvious that fewer full garbage collections occur (4 instead of 9) and that the minor collections remove more garbage (1 Mbyte instead of 0.5 MByte). Because fewer full garbage collections took place the accumulated pause time (Acc Pauses) caused by garbage collections decreased from 4.26s to 2.26s. This means that the application now spends only little more than half as much time on garbage collection than before. This sounds great, but to be honest for this application the overall effect of this improvement isn't terribly large as we didn't have excessive pause times in the first place. But still, the throughput (time the application actually runs and isn't busy with garbage collection) increased from 97.62% to 98.84%. Again - if your real world application has a throughput of over 95% you probably shouldn't bother with tuning garbage collection.
As a side effect of NewRatio=2 we notice that the overall memory consumption (Footprint) slightly increased from 3.364 KByte to 3.604 KByte. This is due to the larger younger generation.
To see whether we can improve the throughput even more, we start another test run with NewRatio=1:
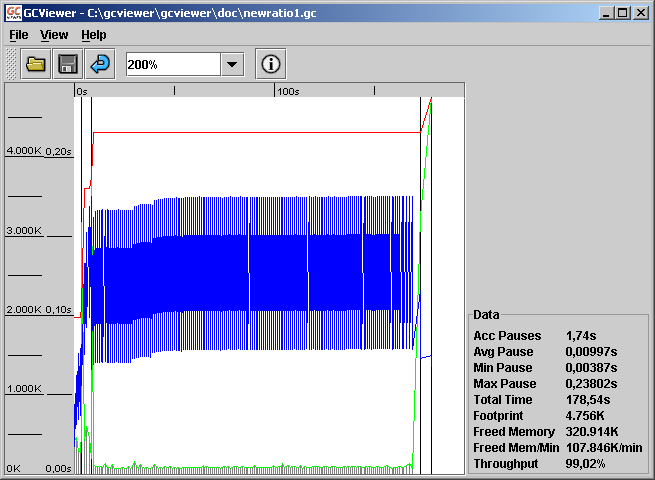
As you can see from the graph there are still four full collections - but they occur in the initialization and shutdown phases of the test run. Also, they don't seem to take a very long time. The sum of all pause times decreased from 2.26s to 1.74s and as a direct result the throughput increased to fantastic 99.02%. The downside of this improvement is the increased footprint of 4.756 KByte.
In our example we used a very simple scenario to demonstrate a single tuning effort. In a real application we would have to make sure that we can repeat test runs in order to compare the values. For the sake of repeatability and not hindering the everyday business you should set up a test environment that is identical to your production environment and run load tests that simulate real load situations. You should also measure the performance of your application without verbose garbage collection in order to measure the real effect of any garbage collection tuning.
GCViewer helps you interpret verbose GC data from your VM. Especially with Sun JVMs, manipulating generation sizes can have a large impact on the behaviour of your application. GCViewer helps you make the correct decisions and run the right tests. Off course this doesn't free you from the task of not producing too much garbage in the first place...
Hendrik Schreiber is author of the German book Performant Java Programmieren published by Addison-Wesley and works as senior consultant for innoQ Deutschland GmbH (see also iQgen). In his spare time he contributes to open source projects such as tagtraum industries and others.
